The Transient Hot Wire Liquid Thermal Conductivity Meter (THW-L1) is a precision analytical instrument for directly measuring the thermal conductivity of liquids and low viscosity pastes, from 10 to 200°C.
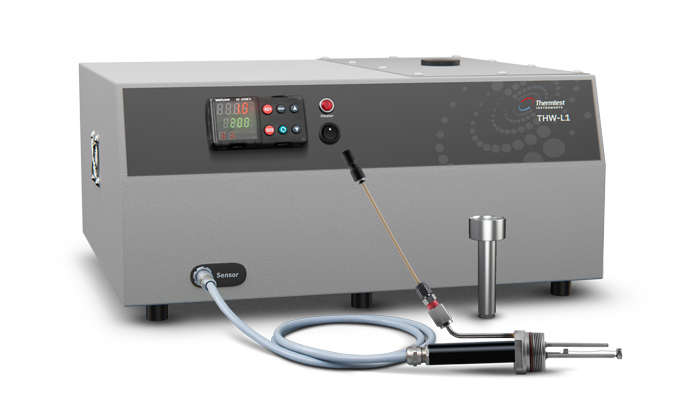
Picture 1. Thermtest THW-L1 Liquid Thermal Conductivity Meter
The Thermtest Transient Hot Wire (THW-L1) Liquid Thermal Conductivity Meter is an advanced measurement system for direct determination of the thermal conductivity liquids and pastes in accordance with ASTM D7896-19 – Standard Test Method for Thermal Conductivity of Engine Coolants and Related Fluids by Transient Hot Wire Liquid Thermal Conductivity Method.
The THW-L1 Meter was designed with speed and operational simplicity in mind. With a single measurement of 1 second in duration, small volumes of liquids and low viscosity pastes can be accurately and precisely measured for thermal conductivity, thermal diffusivity, and specific heat. The THW-L1 Meter uses a non-stationary measurement approach and rapid test times, limiting convective effects for samples with a wide range of viscosities (0.1 to 10,000,000 mPas).
There are limitations on the measurements of the electrically conductive fluids using the transient hot wire (THW) technique, due to the bare wire used on the sensor. Improvements of the experimental set up allow accurate thermal conductivity measurements, even when testing electrically conductive fluids. The typical trend with electrically conductive fluids is as the temperature of the fluid increases, the electrical conductivity increases, which can affect the accuracy of the testing results.
The THW-L1 software lets the user investigate the quality of the measurement, which is important in identifying poor results.
For electrically conductive liquids which affect the accuracy of a measurement, often the starting first few points of the temperature rise vs. time raw data are offset below graphed zero. As shown in Figures 1a, when the electrical conductivity does not affect the accuracy of a measurement, the temperature rise graph starts from positive temperatures. On the other hand, when the fluid’s electrical conductivity of the fluid is high enough for a current, a negative offset appears to the results (Figure 1b).
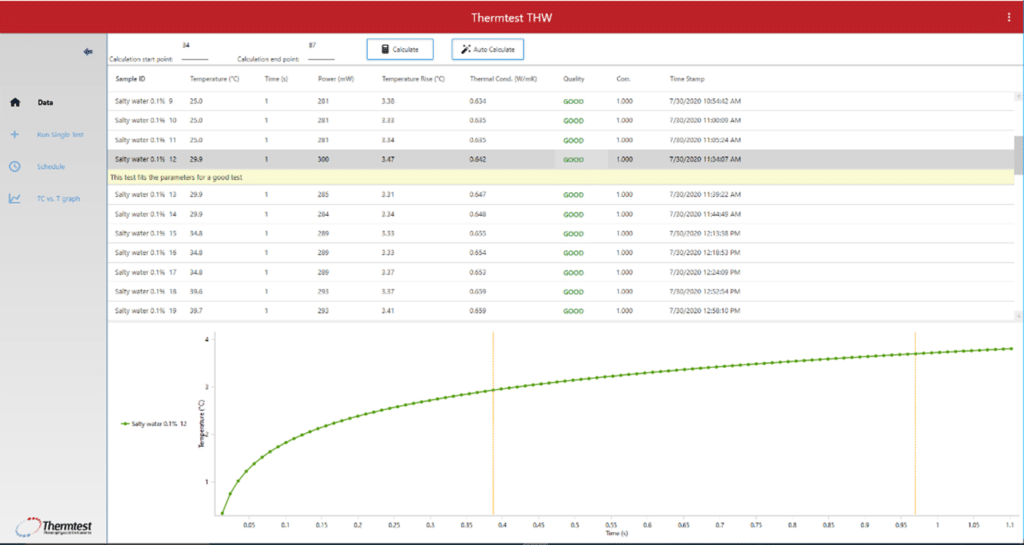
1a
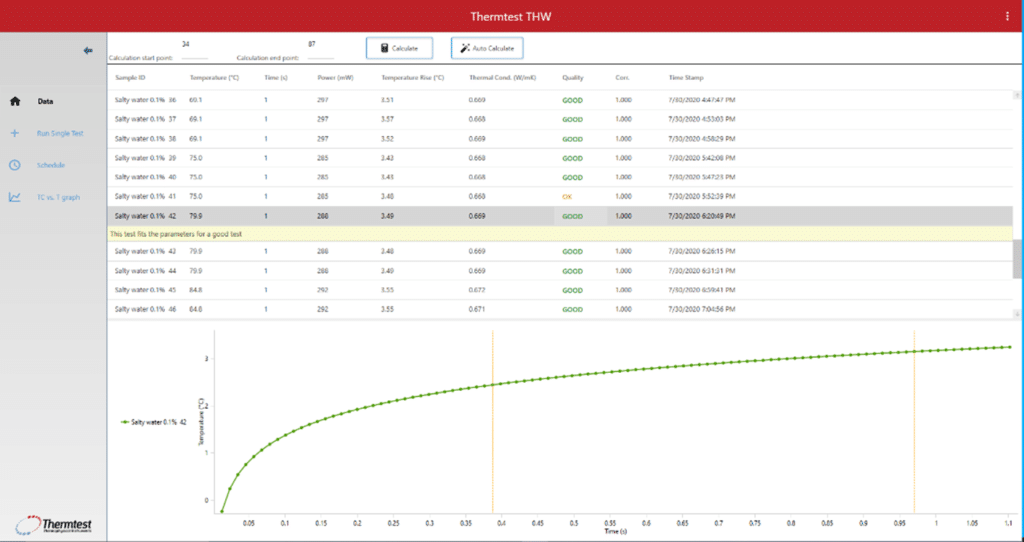
1b
Figure 1. a. Temperature rise when the electrical conductivity of the fluid is not disturbing the thermal conductivity measurements, b. Temperature rise when the electrical conductivity of the fluid is disturbing the thermal conductivity measurements.
The figures below show the experimental results of two salt-water mixtures of 0.1% and 2%, measured with the THW-L1 and a competitive transient hot-wire thermal conductivity instrument (we will refer to as THW-F). In Figures 2-5, the green measurement points show that the experimental data is not affected by the fluid’s electrical conductivity. In contrast, the red measurement points show the experimental data, when the fluid’s electrical conductivity is high, as demonstrated above in figure 1b. The THW-F sensor has no option for the user to review the quality of the measurements.
As shown in Figure 2, the experimental data of salt-water is 0.1%. Since the electrical conductivity of this mixture is low (2.2 mS/cm), both a THW-L1 Stainless Steel (standard) and a THW-L1 anodized aluminum (optional) test cell are used during the measurements. As can be seen, the anodized test cell allows more accurate thermal conductivity measurements at higher temperatures; this is due to the anodizing providing a basic level of electrical insulation. The black line represents the control sample (DIUF water) measurements with the THW-L1 sensor.
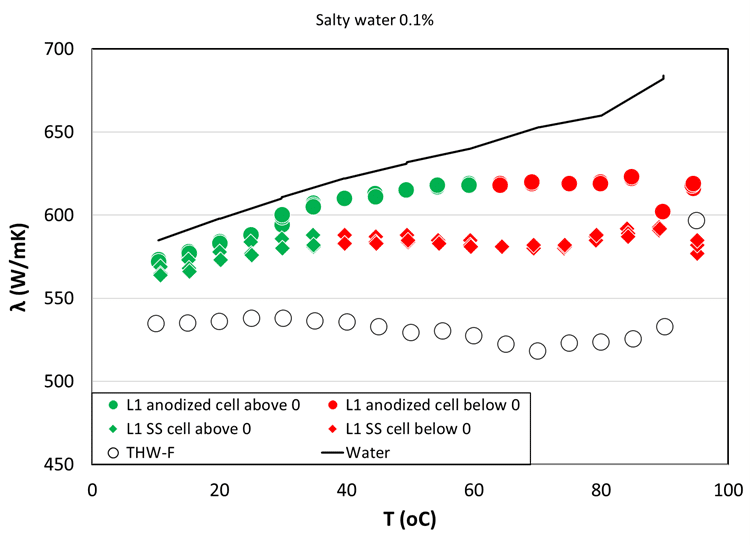
Figure 2. Measured Thermal Conductivity of salt-water mixture 0.1% using the THW-L1 device with an anodized test cell, a basic SS test cell, and the THW-F Device.
The comparison between the experimental data with the literature data for the salt-water mixture and the DIUF water are shown in Figure 3. For the salt-water measurements, the deviations of the experimental data from the literature data were increasing with temperature and were higher when the stainless-steel bucket used. The measurements with THW-F have the highest deviations from the literature values.
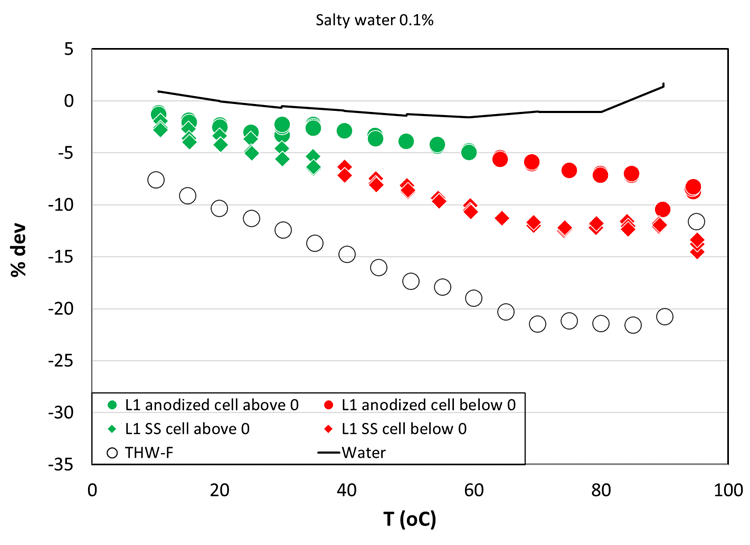
Figure 3. Deviations of the Thermal Conductivity measurements with the literature data of salt-water mixture 0.1% using the THW-L1 device with an anodized cell, a basic SS cell, and a THW-F device.
Figure 4 shows the thermal conductivity measurements of 2% salt-water with calculated electrical conductivity 31.9 mS/cm at 20˚C. When the THW-L1 stainless-steel test cell was used, it was not possible to receive accurate measurements; alternatively, when using an anodized test cell, the measurements were accurate up to 40˚C. During the measurements, a back pressure of 3 bar was applied to the THW-L1 and the THW-F sensor. At higher temperatures, a decrease of the thermal conductivity was noticed for both devices, while the thermal conductivity drop is higher for the THW-F sensor.
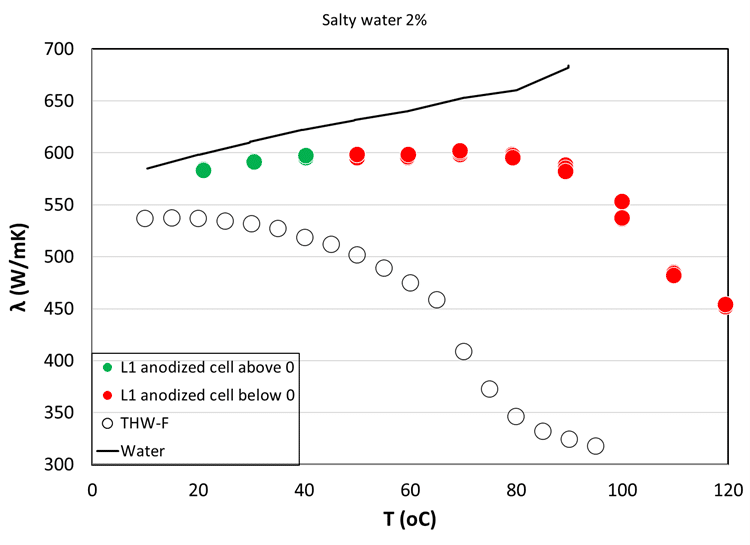
Figure 4. Measured Thermal Conductivity of salty water mixture 2% using the THW-L1 device with an anodized cell and a THW-F device