The Transient Hot Wire Liquid Thermal Conductivity Meter (THW-L1) is a precision analytical instrument for directly measuring the thermal conductivity of liquids and low viscosity pastes, from 10 to 200 °C.
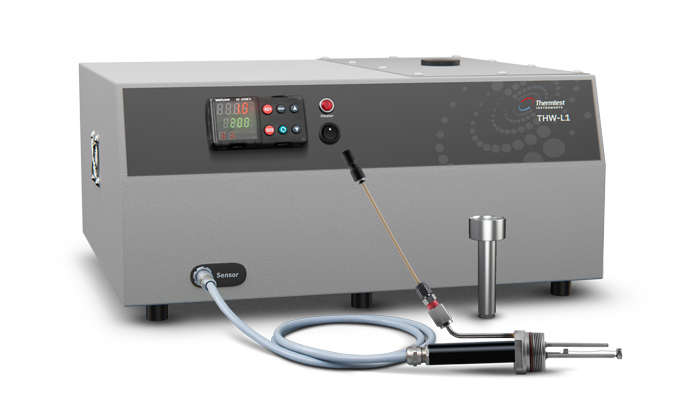
Picture 1. Thermtest THW-L1 Liquid Thermal Conductivity Meter
The Thermtest Transient Hot Wire (THW-L1) liquid thermal conductivity equipment is an advanced measurement system for direct determination of the thermal conductivity liquids and pastes in accordance with ASTM D7896-19 – Standard Test Method for Thermal Conductivity of Engine Coolants and Related Fluids by Transient Hot Wire Liquid Thermal Conductivity Method.
The THW-L1 Meter was designed with speed and operational simplicity in mind. With a single measurement of 1 second in duration, small volumes of liquids and low viscosity pastes can be accurately and precisely measured for thermal conductivity, thermal diffusivity, and specific heat. The THW-L1 Meter uses a non-stationary measurement approach and rapid test times, limiting convective effects for samples with a wide range of viscosities (0.1 to 10,000,000 mPas).
For the measurements of the Phase Change Materials (PCM), a novel cell with easy to load access is used. The unique spring design allows sample expansion and contraction while ensuring the sample is in constant contact with the THW wire during the measurements. The spring on the bottom of the cell allows thermal conductivity measurements over temperatures for fluid thermal expansion up to 15%.
The Coconut oil (Picture 2) is solid or semi-solid at ambient temperature and composition is a mixture of fatty acids such as Lauric acid, Myristic acid, Caprylic acid, Palmitic acid, Oleic acid, Capric acid, Stearic acid, and Linoleic acid.
For thermal conductivity measurements from 10 to 80 °C, an organic virgin coconut oil sample was used. The test cell and the sensor were heated to 70 °C; the melted coconut oil was then poured inside the test cell. The spring-loaded bottom screwed, and the measurements started.
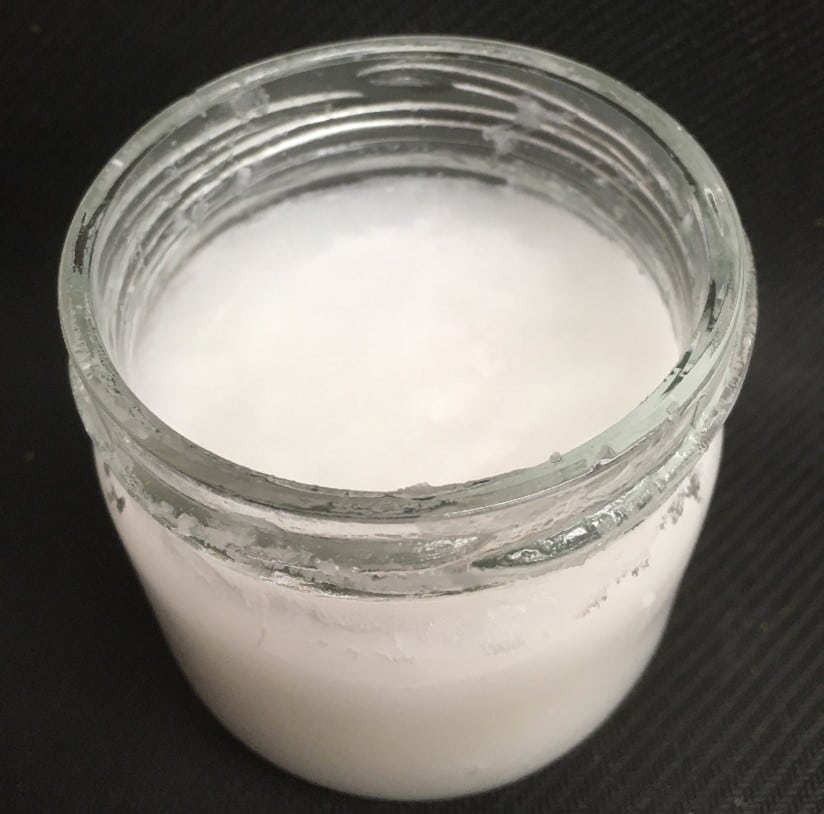
Picture 2. Sample of the Coconut Oil at solid-state.
In Figure 1, all the measurements taken with the THW-L1 device are given. The measurements’ repeatability is better than 1 % even in the phase change temperature range 15 to 20 °C.
Figure 2, shows only one solidifying and one melting run, It can be noticed that even if the thermal conductivity in the phase change region is affected by the exothermic and endothermic processes, the effect is higher during the endothermic melting process as well.
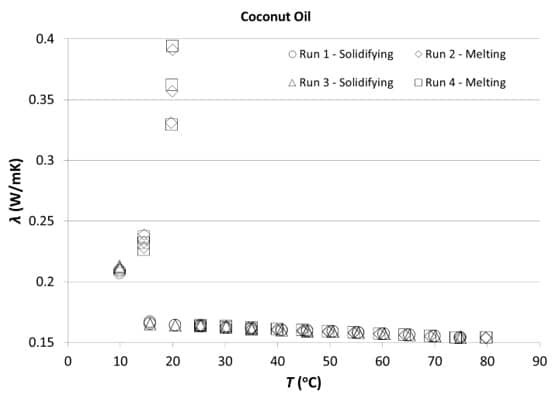
Figure 1. Thermal Conductivity measurements of the Coconut oil sample showing all the measurement runs
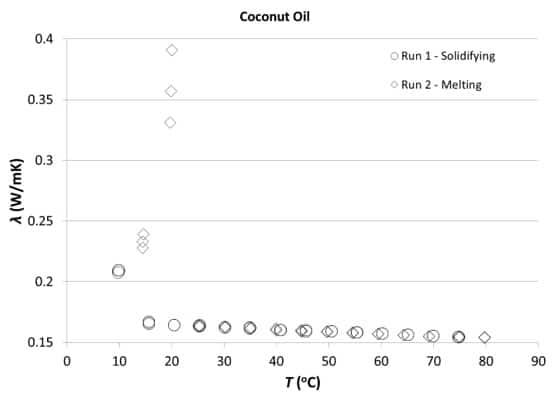
Figure 2. Thermal Conductivity measurements of the Coconut oil sample showing one measurement run
Another food Phase Change Material used for this application sheet is the chocolate chips (Picture 3). The test cell with the spring-loaded bottom and the THW-L1 sensor screwed was preheated in the THW-L1 device up to 80 °C. The chocolate chips melted slowly to avoid burning and poured inside the warm test cell.
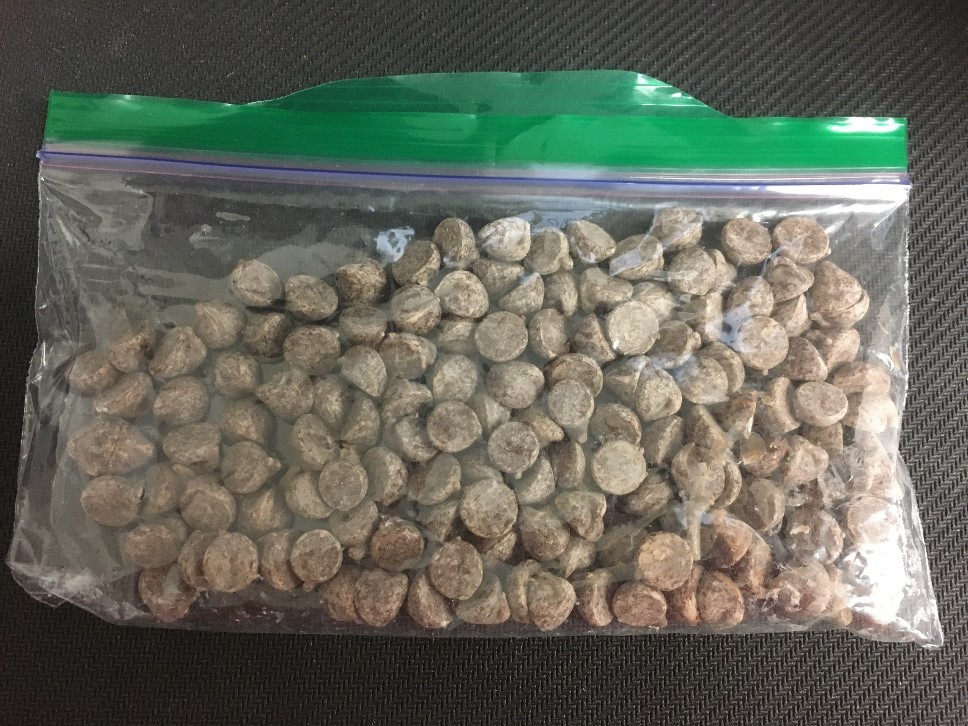
Picture 3. Sample of the Chocolate chips used for the PCM measurements.
Multiple runs of temperature measurements from 80 °C to 10 °C, and then from 10 to 80 °C allowed the recording of thermal conductivity during the solidification and melting of the chocolate chips. In Figure 3, all the measurements taken with the THW-L1 sensor are presented. As can be seen, the measurements are very repeatable during the whole measurement time and temperature range.
The temperature range between 15 to 25 °C is the phase change region. The thermal conductivity measurements are not the real values, as they are affected by the samples’ endothermic and exothermic processes at these temperatures.
Figure 4, shows the different behaviour of the sample during the solidification and melting. It can be observed that the exothermic process during the solidification of the chocolate affects the thermal conductivity less, when compared to the reverse endothermal process during the melting of the chocolate.
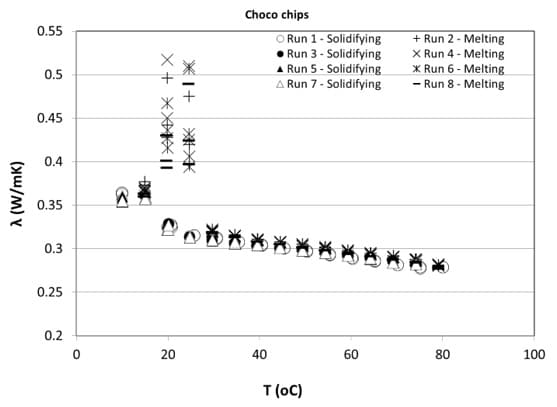
Figure 3. Thermal Conductivity measurements of the Chocolate chips during continuously solidifying and melting steps
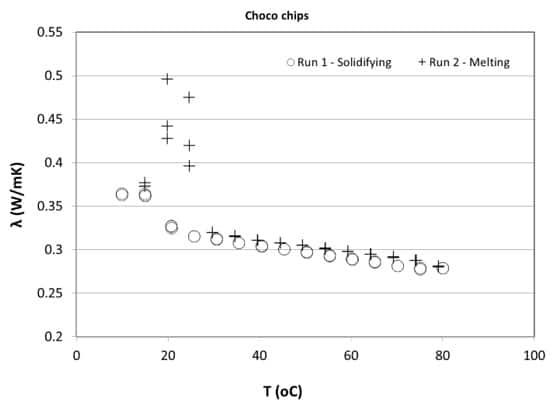
Figure 4. Thermal Conductivity measurements of the Chocolate chips during one solidifying and melting step