The Transient Hot Wire Liquid Thermal Conductivity Meter (THW-L1) is a precision analytical instrument for directly measuring the thermal conductivity of liquids and low viscosity pastes, from (THW-L1) -50 °C / 10 °C to 200 °C and (THW-L1E) -50 °C to 300 °C.
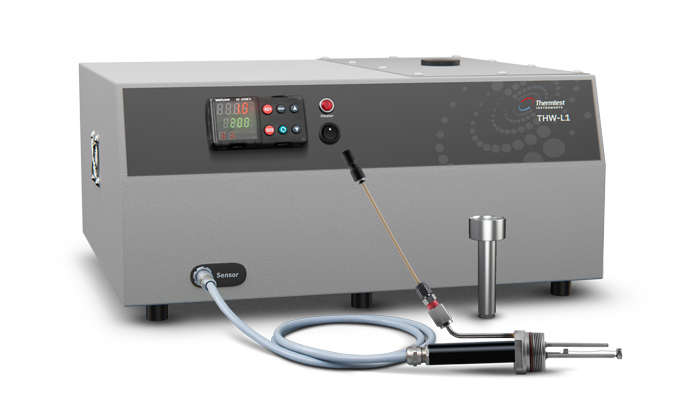
Figure 1. Thermtest THW-L1 Liquid Thermal Conductivity Meter
The Thermtest Transient Hot Wire (THW-L1) is an advanced thermal conductivity instrument for direct determination of the thermal conductivity liquids and pastes in accordance with ASTM D7896-19 – Standard Test Method for Thermal Conductivity of Engine Coolants and Related Fluids by Transient Hot Wire Liquid Thermal Conductivity Method.
The THW-L1 Meter was designed with speed and operational simplicity in mind. With a single measurement of 1 second in duration, small volumes of liquids and low viscosity pastes can be accurately and precisely measured for thermal conductivity, thermal diffusivity and specific heat. The THW-L1 Meter uses a non-stationary measurement approach and rapid test times limiting convective effects for samples with a wide range of viscosities (0.1 to 10,000,000 mPas).
The Engine oil Castrol Edge SAE 5W-30 measured with the THW-L1 device from 5 °C to 195 °C without any back pressure applied to the fluid. Three tests performed at each temperature step and the repeatability was better than 1 %.
In Figure 2, the Engine oil samples can be seen. The left vial is a fresh sample, vial in the middle is after a full temperature run, and the right vial is a sample of used oil from a car engine after 6,000 km.
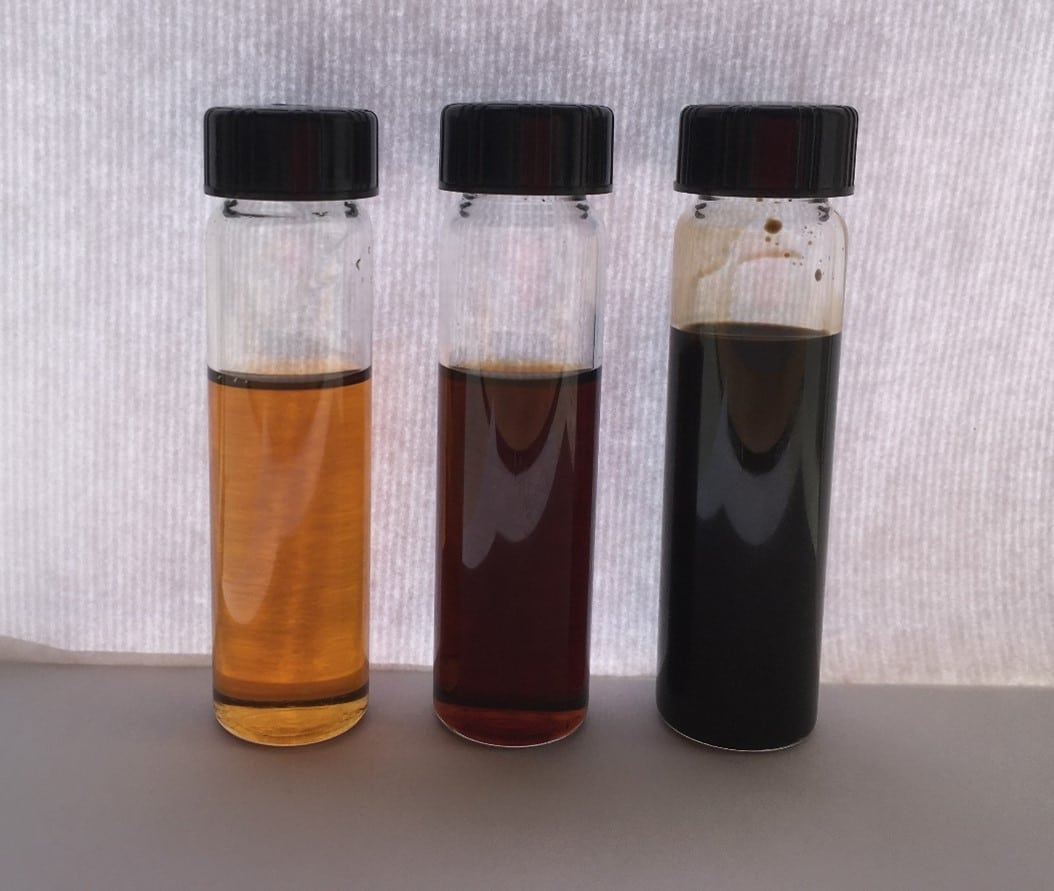
Picture 1. Samples of the Engine oil. From the Left to the Right they are Fresh, after one temperature run and used sample.
Tables 1-3 show the thermal conductivity, thermal diffusivity and volumetric specific heat of both the fresh and the used oil samples, while these data are plotted in Figures 2-4.
It was noticed the thermal conductivity of the used oil is around 2 % lower than the thermal conductivity of the fresh oil sample, while the thermal diffusivity and the volumetric specific heat of the used oil sample was around 1 % lower than the properties of the fresh oil sample. The decrease in repeatability above 170°C is due to a little movement of the liquid and could be improved with use of back-pressure.
Table 1. Thermal Conductivity Measurements of the Fresh and the Used Engine Oil.
| T (°C) | λ (W/m·K) Fresh |
λ (W/m·K) Used |
| 5.1 | 0.139 | 0.136 |
| 10.0 | 0.138 | 0.135 |
| 14.9 | 0.137 | 0.135 |
| 19.8 | 0.137 | 0.134 |
| 24.6 | 0.136 | 0.133 |
| 29.5 | 0.136 | 0.133 |
| 34.4 | 0.135 | 0.132 |
| 39.3 | 0.135 | 0.132 |
| 44.2 | 0.134 | 0.131 |
| 49.2 | 0.133 | 0.131 |
| 54.1 | 0.133 | 0.130 |
| 59.1 | 0.132 | 0.130 |
| 64.0 | 0.131 | 0.129 |
| 69.9 | 0.131 | 0.128 |
| 74.9 | 0.130 | 0.127 |
| 79.8 | 0.129 | 0.127 |
| 84.7 | 0.129 | 0.126 |
| 89.6 | 0.128 | 0.126 |
| 94.5 | 0.127 | 0.125 |
| 99.5 | 0.127 | 0.125 |
| T (°C) | λ (W/m·K) Fresh |
λ (W/m·K) Used |
| 104.4 | 0.126 | 0.124 |
| 109.3 | 0.125 | 0.123 |
| 114.2 | 0.125 | 0.123 |
| 119.1 | 0.124 | 0.122 |
| 124.0 | 0.124 | 0.122 |
| 129.9 | 0.122 | 0.121 |
| 134.9 | 0.122 | 0.121 |
| 139.8 | 0.121 | 0.120 |
| 144.8 | 0.121 | 0.119 |
| 149.7 | 0.121 | 0.119 |
| 154.7 | 0.120 | 0.119 |
| 159.7 | 0.119 | 0.119 |
| 164.7 | 0.119 | 0.117 |
| 169.7 | 0.119 | 0.117 |
| 174.7 | 0.118 | 0.117 |
| 179.7 | 0.120 | 0.118 |
| 184.8 | 0.118 | 0.118 |
| 189.7 | 0.120 | 0.117 |
| 194.6 | 0.120 | 0.116 |
Table 2. Thermal Diffusivity Measurements of the Fresh and the Used Engine Oil.
| T (°C) | α (mm2/s) Fresh |
α (mm2/s) Used |
| 5.1 | 0.077 | 0.076 |
| 10.0 | 0.077 | 0.076 |
| 14.9 | 0.076 | 0.075 |
| 19.8 | 0.075 | 0.075 |
| 24.6 | 0.075 | 0.074 |
| 29.5 | 0.074 | 0.073 |
| 34.4 | 0.073 | 0.073 |
| 39.3 | 0.073 | 0.072 |
| 44.2 | 0.072 | 0.071 |
| 49.2 | 0.072 | 0.070 |
| 54.1 | 0.071 | 0.070 |
| 59.1 | 0.070 | 0.070 |
| 64.0 | 0.070 | 0.069 |
| 69.9 | 0.069 | 0.069 |
| 74.9 | 0.068 | 0.068 |
| 79.8 | 0.067 | 0.067 |
| 84.7 | 0.067 | 0.067 |
| 89.6 | 0.066 | 0.066 |
| 94.5 | 0.065 | 0.065 |
| 99.5 | 0.065 | 0.065 |
| T (°C) | α (mm2/s) Fresh |
α (mm2/s) Used |
| 104.4 | 0.064 | 0.064 |
| 109.3 | 0.064 | 0.063 |
| 114.2 | 0.063 | 0.063 |
| 119.1 | 0.062 | 0.062 |
| 124.0 | 0.062 | 0.061 |
| 129.9 | 0.061 | 0.061 |
| 134.9 | 0.060 | 0.060 |
| 139.8 | 0.060 | 0.059 |
| 144.8 | 0.059 | 0.059 |
| 149.7 | 0.059 | 0.059 |
| 154.7 | 0.059 | 0.058 |
| 159.7 | 0.058 | 0.057 |
| 164.7 | 0.058 | 0.056 |
| 69.9 | 0.069 | 0.069 |
| 74.9 | 0.068 | 0.068 |
| 169.7 | 0.056 | 0.056 |
| 174.7 | 0.056 | 0.055 |
| 179.7 | 0.057 | 0.055 |
| 184.8 | 0.055 | 0.055 |
| 189.7 | 0.056 | 0.054 |
| 194.6 | 0.055 | 0.053 |
Table 3. Calculated Volumetric Specific Heat of the Fresh and the Used Engine Oil.
| T (°C) | vCp (MJ/m3.K) Fresh |
vCp (MJ/m3.K) Used |
| 5.1 | 1.795 | 1.778 |
| 10.0 | 1.803 | 1.783 |
| 14.9 | 1.804 | 1.795 |
| 19.8 | 1.818 | 1.797 |
| 24.6 | 1.819 | 1.804 |
| 29.5 | 1.834 | 1.815 |
| 34.4 | 1.837 | 1.824 |
| 39.3 | 1.845 | 1.837 |
| 44.2 | 1.853 | 1.840 |
| 49.2 | 1.860 | 1.854 |
| 54.1 | 1.871 | 1.852 |
| 59.1 | 1.881 | 1.866 |
| 64.0 | 1.880 | 1.876 |
| 69.9 | 1.899 | 1.872 |
| 74.9 | 1.905 | 1.879 |
| 79.8 | 1.916 | 1.886 |
| 84.7 | 1.923 | 1.894 |
| 89.6 | 1.932 | 1.908 |
| 94.5 | 1.943 | 1.913 |
| 99.5 | 1.951 | 1.932 |
| T (°C) | vCp (MJ/m3.K) Fresh |
vCp (MJ/m3.K) Used |
| 104.4 | 1.959 | 1.940 |
| 109.3 | 1.968 | 1.947 |
| 114.2 | 1.989 | 1.959 |
| 119.1 | 1.993 | 1.965 |
| 124.0 | 1.997 | 1.981 |
| 129.9 | 2.002 | 1.988 |
| 134.9 | 2.030 | 1.999 |
| 139.8 | 2.022 | 2.019 |
| 144.8 | 2.040 | 2.027 |
| 149.7 | 2.035 | 2.040 |
| 154.7 | 2.046 | 2.048 |
| 159.7 | 2.069 | 2.082 |
| 164.7 | 2.071 | 2.089 |
| 169.7 | 2.107 | 2.090 |
| 174.7 | 2.109 | 2.128 |
| 179.7 | 2.109 | 2.130 |
| 184.8 | 2.148 | 2.149 |
| 189.7 | 2.138 | 2.163 |
| 194.6 | 2.173 | 2.186 |
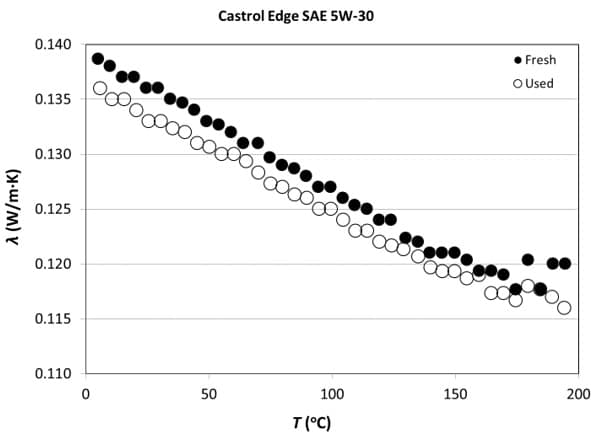
Figure 2. Measured Thermal Conductivity of the Fresh and Used Engine Oil samples
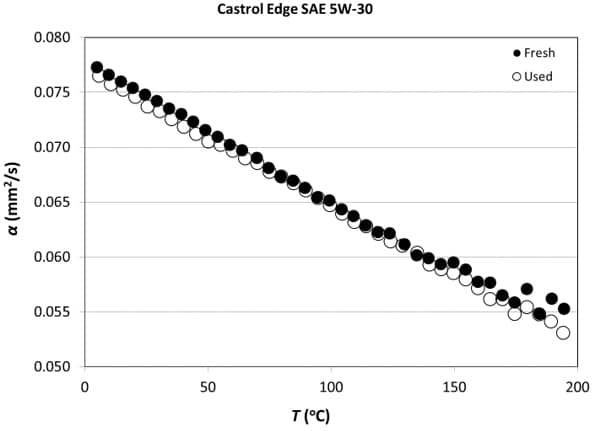
Figure 3. Measured Thermal Diffusivity of the Fresh and Used Engine Oil samples
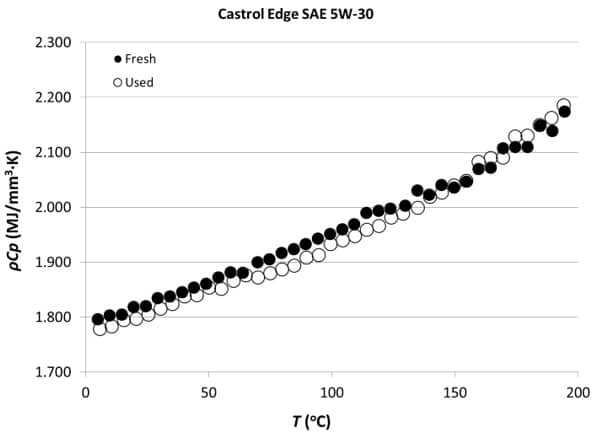
Figure 4. Calculated Volumetric Specific Heat of the Fresh and Used Engine Oil samples