
May 3, 2024

July 7, 2022

June 24, 2022

January 24, 2022

October 28, 2021

November 26, 2018

July 8, 2019

June 9, 2017

September 22, 2017

September 27, 2017

July 24, 2017
September 22, 2017
September 27, 2017
November 26, 2018

January 30, 2019
When performing an experiment and carefully following the proper procedure methods, the results obtained should be relatively accurate. Many experiments require multiple trials and sometimes never result in a complete conclusion.
The specific heat test described in this article required many modifications and repetitions to display conclusive results. The results obtained were relatively accurate even taking into consideration the modification of using a calorimeter made of Styrofoam cups. Often results from experiments using modifications can be inaccurate or inconclusive, especially when there is only a single recorded data point. In this article we will go through proper data acquisition and analysis.
When using proper procedure for this in-home experiment, it is unlikely that 100% accuracy will be achieved due to the unstoppable nature of thermodynamics. Following this method can give an accuracy of approximately 80%. This is a respectable degree of accuracy to be achieved from a simple DIY application.
The procedure for this experiment is thoroughly covered in the coinciding Specific Heat Test article. A brief summary of the procedure is outlined below.
A mass of water was measured than poured into the calorimeter, the water remained there until it reached room temperature. For the most accurate and readable results, there should only be enough water in the calorimeter to completely cover the sample.
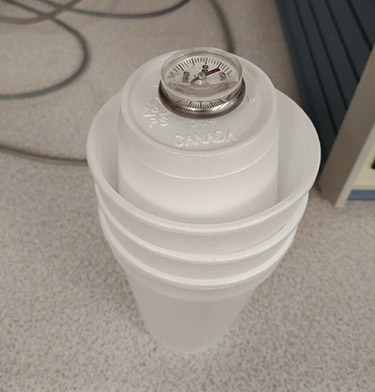
Figure 1: Calorimeter made of two Styrofoam cups and a thermometer
A beaker filled with approximately 300mL of water was placed on a hot plate. A sample of the stainless-steel variety used for the purpose of this experiment was then placed in a test tube and set in a stand so that the majority of the tube was submerged in the beaker. The sample tube was placed vertically to ensure that it did not come into contact with the bottom or sides of the beaker. Once the sample tube was placed properly; the hot plate was turned on.
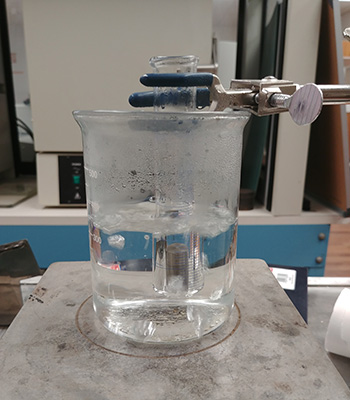
Figure 2: Beaker on a hot plate with a test tube containing the sample submerged in boiling water
During the initial trial of this experiment a solid 25.22-gram cylindrical stainless-steel-316 sample was used. Using a test tube to hold the sample in the water (as shown above), did not lead to favorable results. This poor experimental outcome is likely due to the sample’s radius being smaller than the radius of the test tube. This additional space around the sample added a layer of insulating air in the test tube. This error could be averted if the sample were a powder or composed of smaller pieces.
However, if changes were made to the sample at this point in the experiment, the sample would be completely destroyed. For the remainder of the experiment the sample was held in place with a pair of insulated tongs instead of the test tube. Altering this element of the procedure for the remainder of the trials dramatically improved the results.
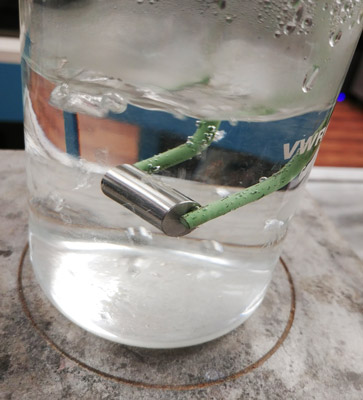
Figure 3: Beaker on a hot plate with a sample submerged and hovered above the bottom by tongs
Once the water in the beaker was boiling, it was recommended to wait approximately 10 minutes to ensure the sample is evenly heated. Note that to achieve a boiling condition the sample needs to be heated to 100 degrees Celsius.
After 10 minutes the test tube was detached from the stand and the sample was poured into the calorimeter. The sample must be poured safely but quickly into the calorimeter, so that a minimal amount of heat is lost to the surrounding air. It is also crucial not to transfer any water from the beaker into the calorimeter. If water from the beaker entered the calorimeter in would add heat that is unrelated to the sample and alter the calculated mass of water.
A Styrofoam cup calorimeter was used for the first two trials of this experiment. For the third and fourth trials a metal thermos replaced the Styrofoam cups to determine the difference a conductive material had on the results.
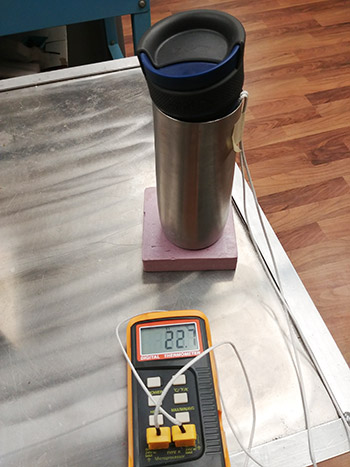
Figure 4: A Calorimeter made from a thermos and a digital thermometer
Once the sample was stabilized in the enclosed calorimeter, data was collected from the thermometer. For the purposes of this experiment, data was recorded at every 30 second interval. However, this experiment is not time sensitive so depending on the conditions, data can be reordered at multiple different intervals. Data was continuously recorded until the temperature of the substance started to drop indicating that the highest possible temperature was achieved.
Recording temperatures at intervals is the recommended option compared to just waiting for the temperature peak. Having a consistent recording time ensures the most accurate results and minimalizes chances for error.
The data obtained from the temperature analysis was entered into Microsoft excel (any program would suffice). Using Microsoft excel the data was placed into a graph format for easy comparison between trials. The graphs produced from the data would indicate any errors that could have possibly occurred during the experimental trials. If errors are observed the experiment would have to be repeated before continuing further analysis.
Acceptable data will display a noticeable curve in the graph indicating the relationship between temperature and time. Additional modifications that could be implemented to improve results could be breaking the sample into smaller pieces, having a larger mass of sample or having less water in the calorimeter. All of these would impact the deviation in the temperature difference displaying more drastic changes in temperature. Increased variation would make the results more noticeable and the data calculations would also be more accurate.
The time that the peak temperature occurred is displayed noticeably in the graphs of the experimental data. Depending on the compatibility of the data with the software being used for the analysis a line of best fit can be produced from the peak temperature. Errors bars are optional depending on the purpose of the experiment and the results obtained. The majority of the error in the results would be due to the unpreventable loss of heat to the air and the calorimeter.
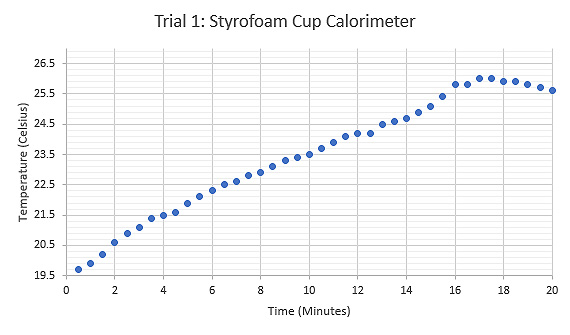
Figure 5: Graph displaying the relationship between Temperature (°C) and Time (minutes) during the first trial using a Styrofoam cup calorimeter and heated sample test tube
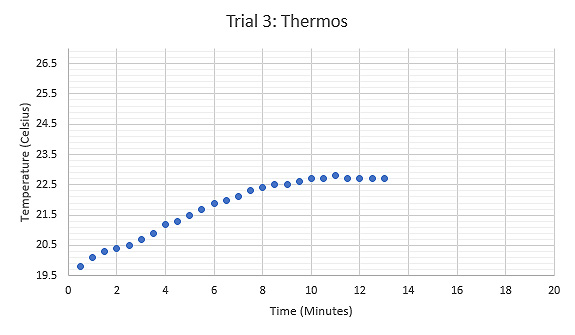
Figure 7: Graph displaying the relationship between Temperature (°C) and Time (minutes) during the third trial using a thermos as the calorimeter, tongs held the sample while heated.
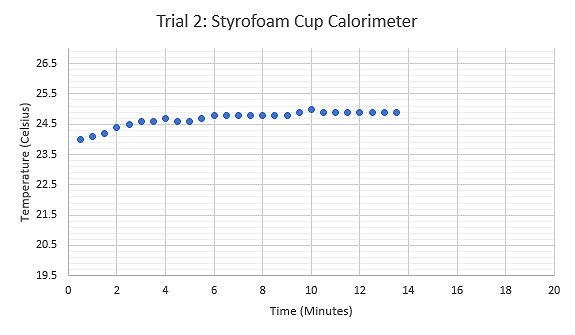
Figure 6: Graph displaying the relationship between Temperature (°C) and Time (minutes) during the second trial using a Styrofoam cup, tongs held the sample while heated.
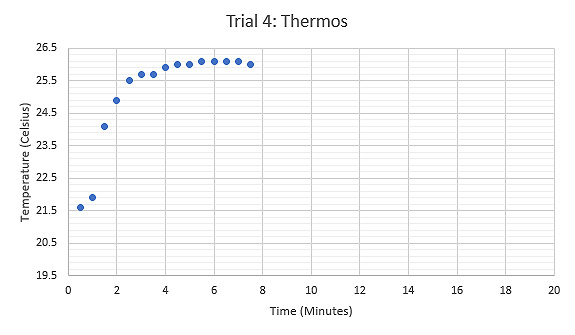
Figure 8: Graph displaying the relationship between Temperature (°C) and Time (minutes) during the fourth trial using a thermos at room temperature as the calorimeter, tongs held the sample while heated.
(Note that the ideal form of a graph of temperature change versus time due to a gradient would be logarithmic.)
The first law of thermal dynamics states that all energy in the universe is conserved. This law can be applied to the results from the experiment. When the sample cools down, energy is lost in the form of heat. As the law states, this energy doesn’t just disappear, in the case of this experiment that energy is absorbed by the water. This increase in energy will cause the water’s temperature to rise. Measuring this change determines the amount of heat absorbed by the water which leads to determining the heat lost by the stainless-steel sample.
Qw = -Qs Where Q is the change in heat.
Using specific heat of water and the mass of water being used, we can express the above more informatively.
Qw = cwmw(Tpeak – Tinitial)w = -Qs = csms(Tpeak – Tinitial)s
The formula can then be rearranged for determining the specific heat of the sample.
cs = cwmwΔTw / msΔTs
For the first trial of the experiment, Styrofoam cups were used as the calorimeter along with a test tube for holding the sample. The results from this trial were inconclusive and had a large amount of error. In the second trial a pair of insulated tongs replaced the test tube for holding the sample. The results from this trial displayed substantially less error. Modifications were made for the second trial in an attempt to produce viable results.
In the second trial, the water in the calorimeter rested longer at room temperature before the data was collected. This modification produced a result of 305.4 Joules per kilogram kelvin, which was 67.9% accurate to the theoretical value of grade 316 stainless steel, 470.
Another modification was used for the third and fourth trial to determine the change in accuracy when using a conductive calorimeter. A standard beverage thermos was used as the calorimeter for these trials. The thermometer used to measure temperature was upgraded to a digital one with long wire probes that enabled the thermos to have a tight seal. The first trial using this modification produced a result of 553.29 Joules per kilogram kelvin, which is 84.9% accurate, however, it was above the theoretical value. Accuracy above theoretical value indicated that an error was made.
Using a thermos as the calorimeter means that the water would take longer to reach room temperature. It is debatable if the water inside the thermos not being at room temperature would affect the results of the experiment. However, after further analysis the size of the thermos was determined as the cause of error in accuracy values. Due to the large size of the thermos, additional spaced remained inside the container for room temperature air to be trapped when the lid was placed on. This large volume of air was in direct contact with the water inside the thermos and affected the water’s temperature.
A further modification was made for the fourth trial of this experiment to limit error caused by the room temperature air. Only enough water to cover the sample was added and it was stressed that this water was at room temperature. This modification received results of 367.56 Joules per kilogram kelvin, which is 78.2% accurate.
An accurate result was not the goal of these experiments. Science is a slow process that is full of opportunity for mistakes, trial and error, and improvement. Scientific theories take years to develop and even longer for the scientific community to accept them. Science is an art and should be played with. Most earth-shattering discoveries were made by accident or with a different end goal in mind. For experiments such as the one described above, it is good practice to aim for an 80% accuracy for an at home value. When experimenting, it is key to have an open mind, roll with punches and most of all be safe.
‘Theory of Heat’ – Maxwell, James Clerk – page 57-67 – Westport, Conn., Greenwood Press – 1970: https://archive.org/details/theoryheat04maxwgoog/page/n77
-Talks about conservation of heat, the form, function and a bit of history of calorimeters, and the Method of Mixture. It is also a good book to understand heat in general, and it’s free.
Author: Cole Boucher, Junior Technical Writer at Thermtest