Join us at the International Thermal Conductivity Conference (ITCC) and the International Thermal Expansion Symposium (ITES).

July 7, 2022

June 24, 2022

January 24, 2022

October 28, 2021

June 21, 2021
March 16, 2021
November 18, 2020

September 30, 2020

September 29, 2020

May 8, 2020

April 1, 2020
March 24, 2020

September 10, 2019

July 18, 2019

July 8, 2019

June 11, 2019

June 4, 2019

May 31, 2019

May 27, 2019

May 13, 2019
April 9, 2019

January 30, 2019

November 26, 2018

September 12, 2018
September 11, 2018

August 13, 2018

August 10, 2018

February 9, 2018
February 1, 2018

January 25, 2018

January 16, 2018

January 12, 2018

January 11, 2018

November 29, 2017
October 3, 2017

September 27, 2017

September 22, 2017

August 1, 2017

July 24, 2017

July 21, 2017
June 9, 2017
June 8, 2017
May 23, 2017
May 19, 2017
May 17, 2017

May 15, 2017

January 24, 2017
July 7, 2022
June 24, 2022
January 24, 2022
October 28, 2021
June 21, 2021
July 8, 2019
September 22, 2017
June 9, 2017
November 26, 2018
September 27, 2017
July 24, 2017
September 22, 2017
September 27, 2017
November 26, 2018
January 30, 2019
This antique piece of equipment was originally sold by Philip Harris LTD, out of Birmingham, England. It is designed to be a visual method that allows students to easily find the thermal conductivity of copper experimentally. This model is likely the most aesthetically pleasing and it appears to be in top quality. The ideal condition of this model created a great opportunity to rekindle an experiment that has an important place in history.
A steam generator was prepared for this experiment in the form of a sealable aluminum container capable of holding 2 litres of water. It also had an offshoot near the top capable of being attached to an end of rubber tubing. The other end of that tubing was fit onto the inlet of the steam chamber. Another piece of tubing ran from the exhaust pipe to a small bucket which would catch any water that may be pushed through the steam chamber when the water reached boiling.
Instead of using a water supply sourced from a tap, a device called a ‘circulating bath’ was used that would continuously recycle the same liquid through the coolant pipe keeping the liquid at the same temperature. This was done to prevent the waste of a large amount of water and because water from a tap does not remain at a constant temperature. A variance in the water’s temperature or pressure could lead to a slightly different amount of heat being absorbed by the water per second, which could lower the accuracy of the results. The recycling cooling pump avoids that problem by continuously pumping the liquid at a flow rate of 5 g/s and keeps its output at 10 °C (standard tap water temperature).
Spatial measurements were made before commencing the experiment. These measurements included; distance d between the two places that temperature was measured (located along the middle of the bar called T1 and T2) and the diameter of the bar. Once these measurements were recorded, rubber tubes were connected from the recycling pump to the ‘in’ and ‘out’ ports of the coolant pipe. Four thermometers were placed in the four convenient holes on the top of the apparatus, along with a bit of water for a temperature bath. The sides of these holes are made of copper and are in direct contact with the copper bar so they will be essentially the same temperature as the bar. To ensure that the apparatus was functioning correctly, the coolant liquid pump was started to make sure it can run unobstructed through the tight coil. Using the recycling coolant pump, plugs were placed in the holes for T3 and T4, as the minimum flowrate of 5g/s was too fast to allow the liquid time to be pushed through the cooling coil from just its own weight.
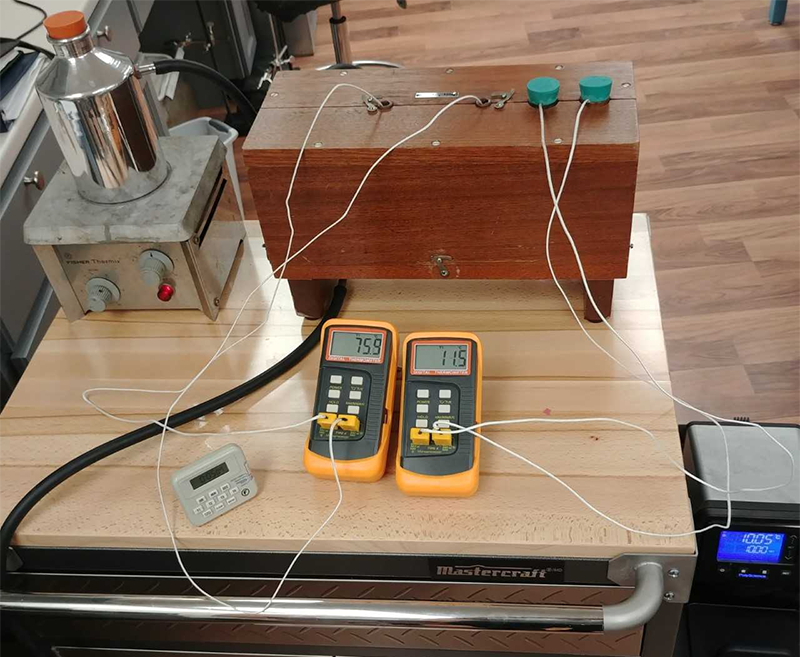
Figure 1: Searle’s Bar apparatus in use
During this experiment, the flow rate through the cooling coil is known. If it weren’t known it could be measured by disconnecting the source and directing the flow into a beaker of known mass while monitoring a stopwatch for a time. To determine flow rate, divide the exited mass by the number of seconds it takes to accumulate in the beaker. The steam generator was placed on a hot-plate, or some other heat source. As the water reached a boil temperature (100°C), steam began to gather in the steam chamber and heat the bar before being exhausted out the bottom. The recycling coolant pump started at room temperature, so half an hour was allowed for it to cool the liquid to 10°C.
When both the heating and cooling systems are running at a full and constant rate, energy in the form of heat will start to migrate along the bar. Eventually the rate of heat transfer along the rod will be constant. This means there will be no significant change in temperature (more than 0.5 °C) over 5-10 minutes. When this happens, the bar is in a steady state. Although there is a temperature gradient across the bar, heat is leaving it just as fast as it enters, creating no change in temperature anywhere along the bar. Approximately an hour was needed before a steady state was achieved. Once a steady state has been reached, a careful recording of the readings from all four thermometers was taken. These thermometers were labelled T1, T2, T3 and T4.
The following equation can be found in Thermtest’s other Searle’s Bar articles. For more information of the theory behind it, and its derivation, refer to the articles ‘Searles Bar Experiment’ and ‘Thermal Conductivity Meter: Searle’s Apparatus’.
\[ k = \frac{cmd}{A} frac{(T3-T4)}{(T1-T2)} \]
After to building an equation, it is important to check the resultant units to ensure the logic is valid.
\[ \Bigg[ \frac{J}{gK} \Bigg] \Bigg[ \frac{g}{s} \Bigg] \frac{[m]}{[m^2]} \frac{[C]}{[C]} \]
= [ Jgm/gKsm2 ]
= [ J/smK ] remember, 1 J/s = 1 W
= [ W/m•K ] The correct units for thermal conductivity
Using the Searles bar, d was found to be 98.75mm, and the diameter was 38.2mm. The coolant used by the recycling coolant pump was not pure water. The mixture used was a 70% water and 30% ethylene glycol. Specific heat can be determined by using the method of mixture formula indicated below.
c = 0.7*cw + 0.3*ceg = 3.6446 J/gK
With this value all the necessary information has been collected to use the equation for thermal conductivity found above.
k = [(3.6446J/gK * 5g/s * 0.098.75m)/(pi * 0.0382m/2)] * [(18.6 °C – 11.4 °C)/(75.7 °C – 45.6 °C)]
= 375.5 W/m•K
As expected, the temperatures changed quickly at first before slowing to a steady state condition. This experiment achieved popularity in part because it doesn’t require any heavy calculations or even a watchful eye until a steady state is suspected to have been reached. The value determined by the experiment analyzed in this article (375.5 W/m•K) is 94.5% accurate to the known value of thermal conductivity of copper, which is 397.48 W/m•K. This high accuracy may be in part due to the high-quality equipment that was used, such as the recycling coolant pump that kept the temperature and pressure of the coolant liquid constant as well as the digital thermometers with accurate readings. The main source of error is the loss of heat along the length of the bar to the surroundings. This effect has been lessened by the insulation, but there is no perfect insulator so some heat will inevitably be lost through the sides.
Paraphrasing Dr. Searle from his paper, the purpose of this experiment is not to find accurate results of previously unknown values of thermal capacities, but it is useful because it provides a visible, tangible example of a concept that had previously only been explored in scientific papers and in class lectures. It was Dr. Searle’s view that if someone could find some knowledge through experimentation on their own, then that knowledge would seem more obvious to them and not be forgotten easily.
Dr Searle, G.F.C, (1905). A method of determining the thermal conductivity of copper. Philosospical Magazine, 6(9), 125 129, doi.org/10.1080/14786440509463260 https://www.tandfonline.com/doi/pdf/10.1080/14786440509463260?needAccess=true
Thomson, G, (October 1955). GEORGE FREDERICK CHARLES SEARLE. Biographical Memoirs of Fellows of the Royal Society 1:246-252: https://royalsocietypublishing.org/doi/pdf/10.1098/rsbm.1955.0018
Author: Cole Boucher, Junior Technical Writer at Thermtest


